| Top > Technical-notes > VNWA > How to use Create-dB&Zgraph-from-VNWAs1p calculation sheet. |
| Top > Technical-notes > VNWA > How to use Create-dB&Zgraph-from-VNWAs1p calculation sheet. |
| First, measure and extract the S21 frequency characteristic data of the
line filter on the page below. Import the extracted data into EXCEL. ↓↓ |
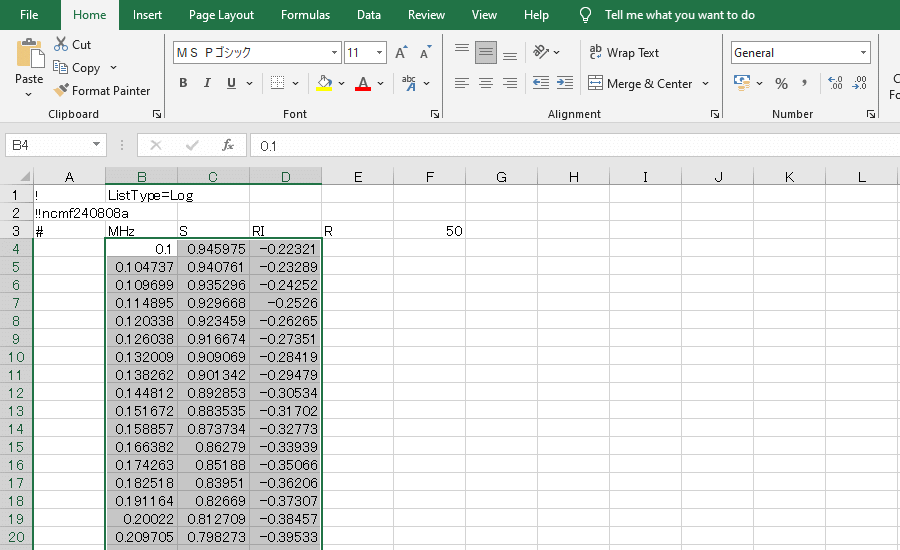
| Import Line-Filter's VNWA data into EXCEL. |
| Select and copy from Selecting the minimum to maximum frequency in columns B, C, and D. |
 |
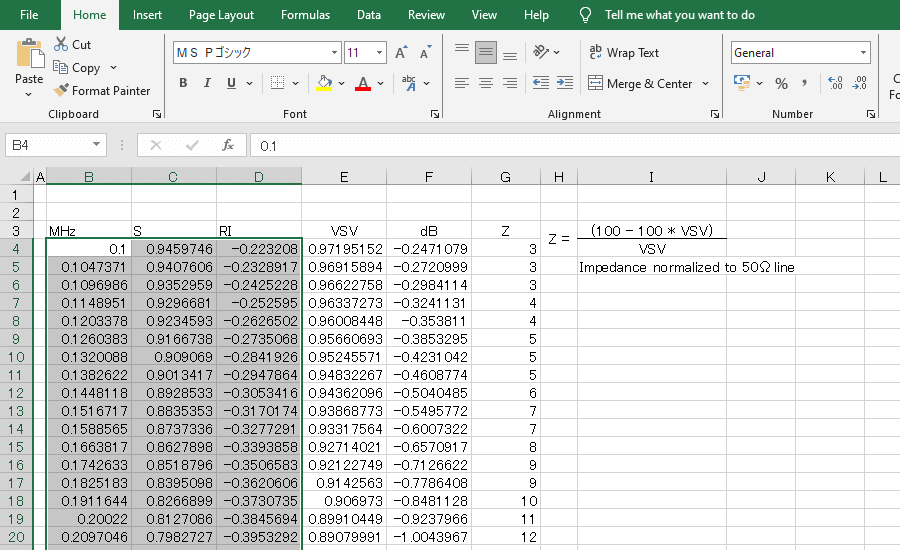
| Paste it into the calculation sheet at the same coordinates. |
 |
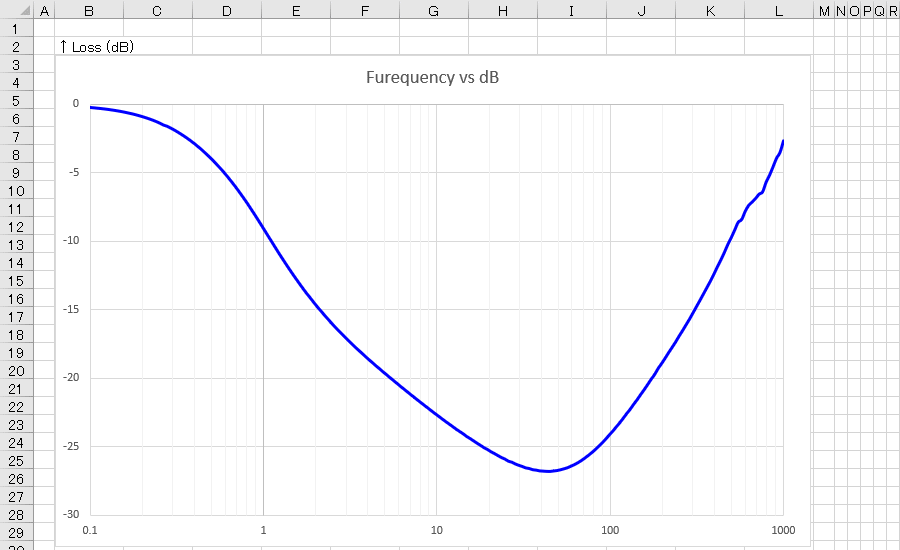
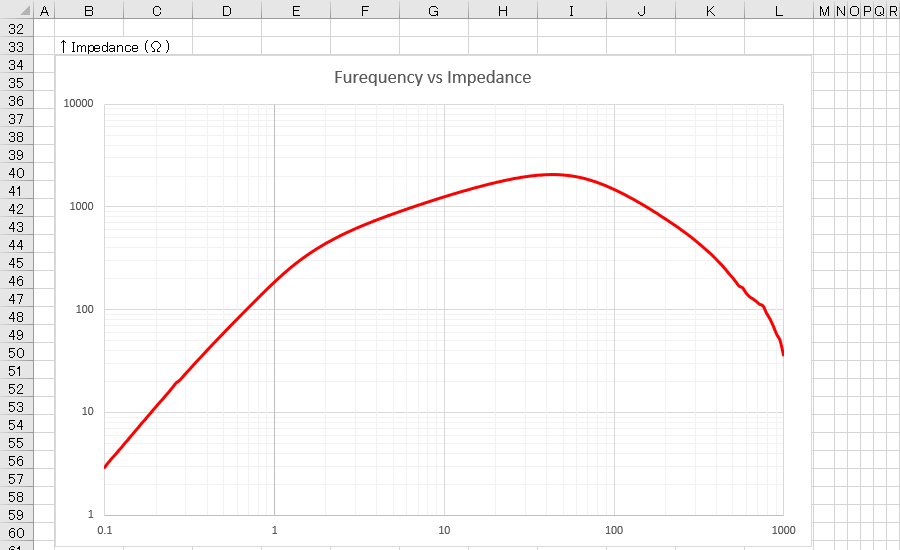
| If you check the Graph cell, you will see that the Loss (dB) graph and Impedance (Ω) graph are complete. |
 |
 |
| Click here to download CalculateGraph-dBZ-from-VNWAs1p.xlsx |