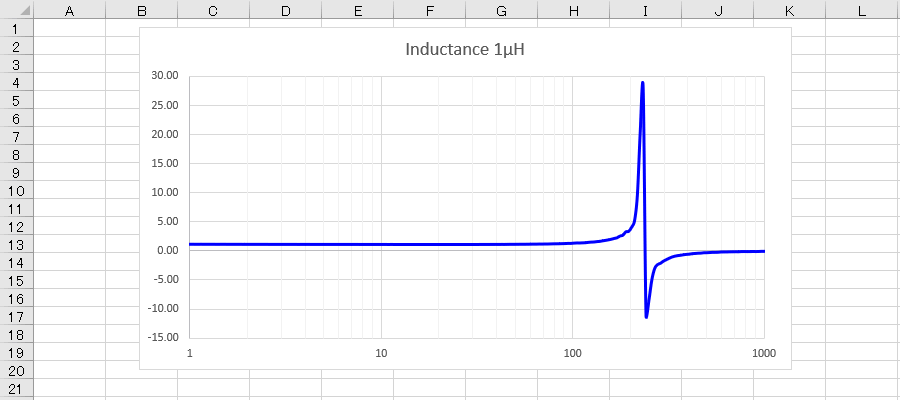
| Top > Technical-notes > VNWA > Displays the converted Inductance data as a graph. |
| Top > Technical-notes > VNWA > Displays the converted Inductance data as a graph. |
Create a frequency-inductance graph of coil using EXCEL.
| Import Inductor's VNWA S11data into EXCEL. Convert Inductor's VNWA-s1p data to inductance. |
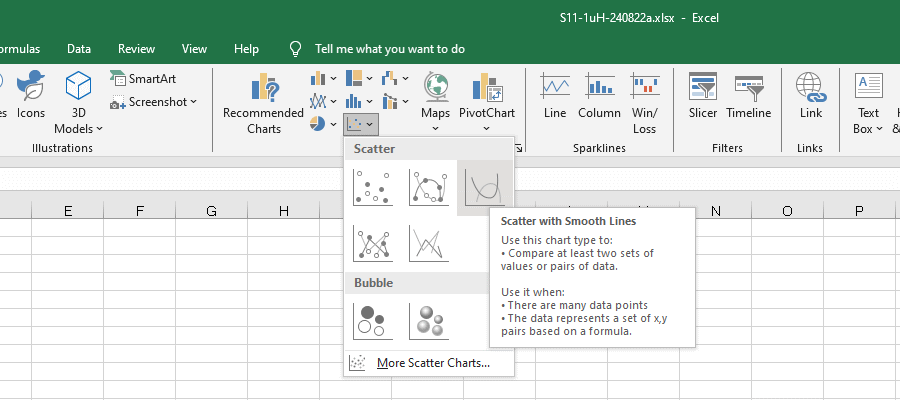
| Select the Scatter with Smooth Lines for the graph. |
 |
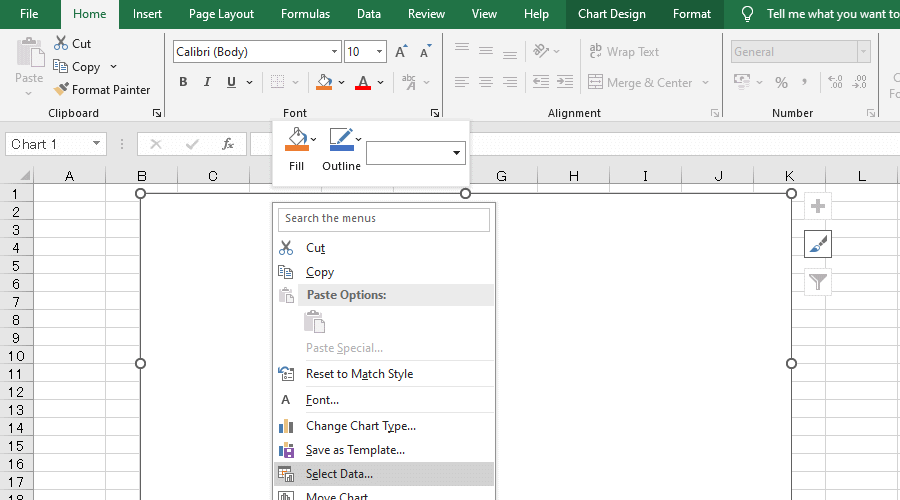
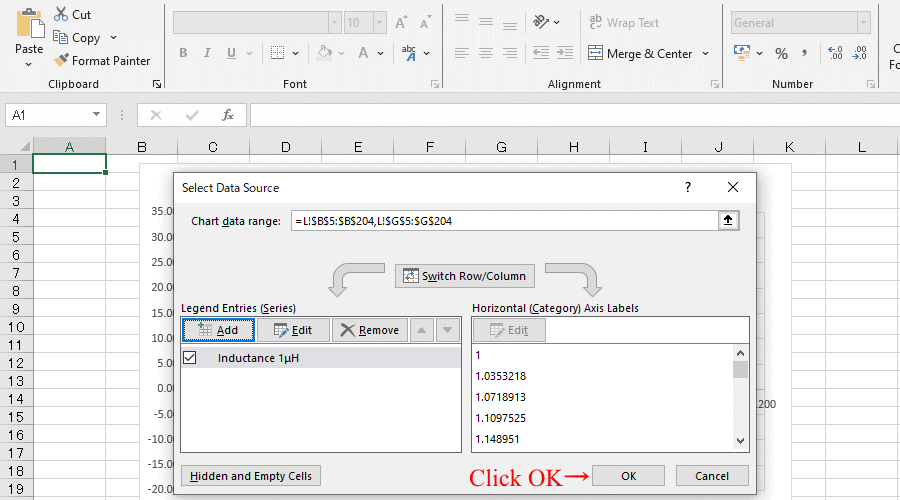
| Right-click the chart area and click Select Data. |
 |
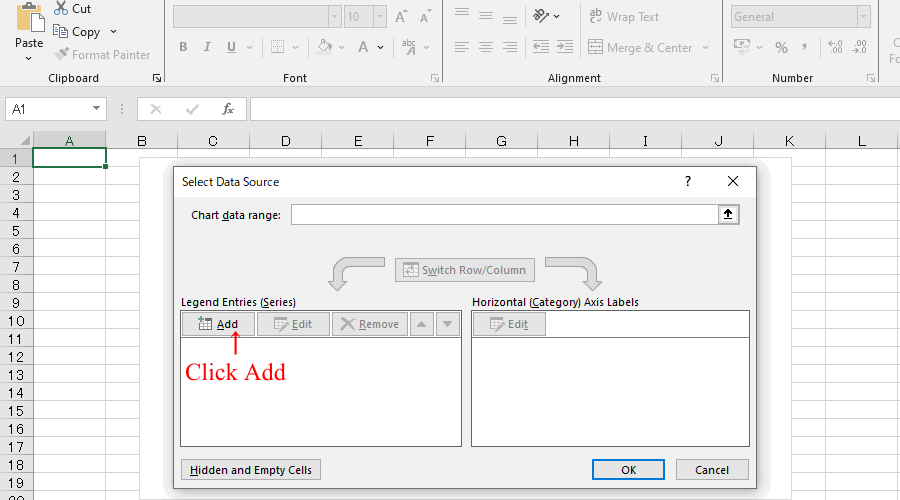 |
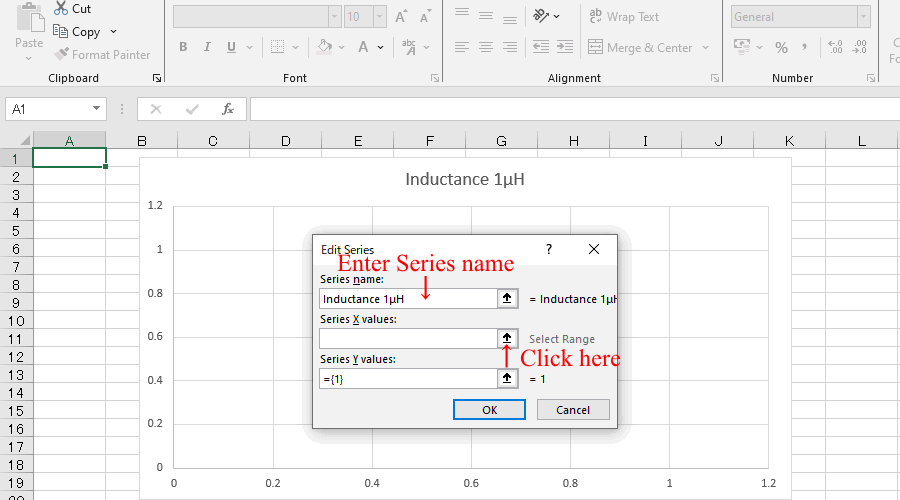
| Enter the Series name and then click the Select Range arrow. |
 |
| A small window will appear; open the file or sheet containing the converted data, Select all frequency data and click the arrow. |
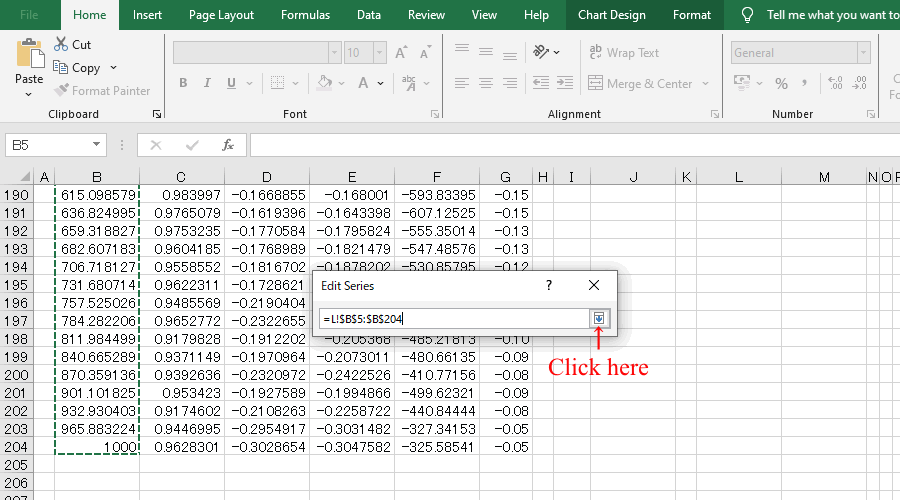 |
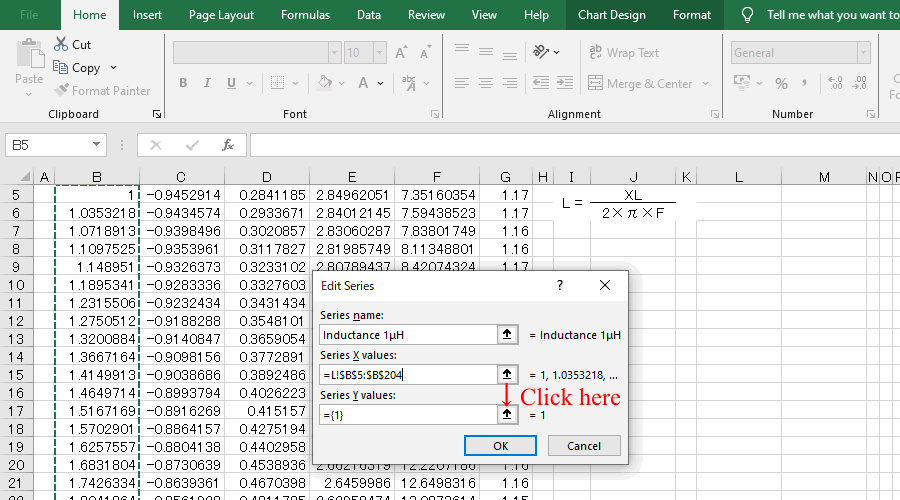 |
| A small window will appear; open the file or sheet containing the converted data, Select all μH data and click the arrow. |
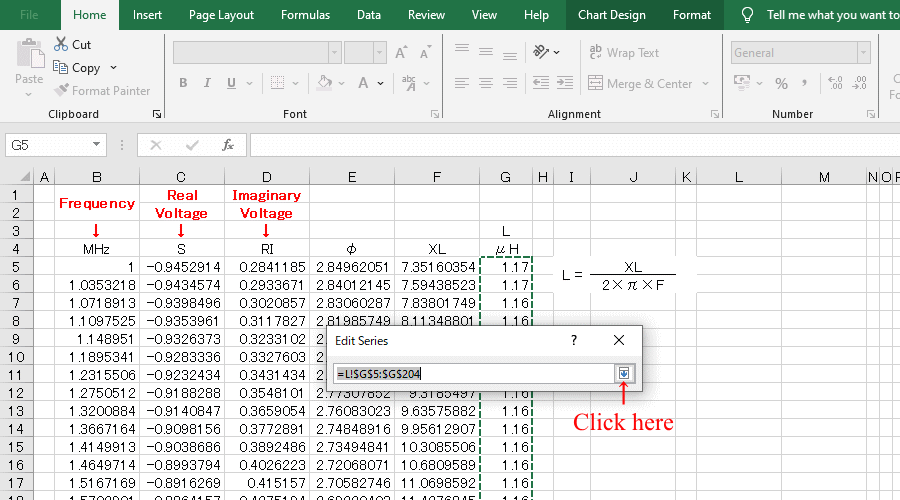 |
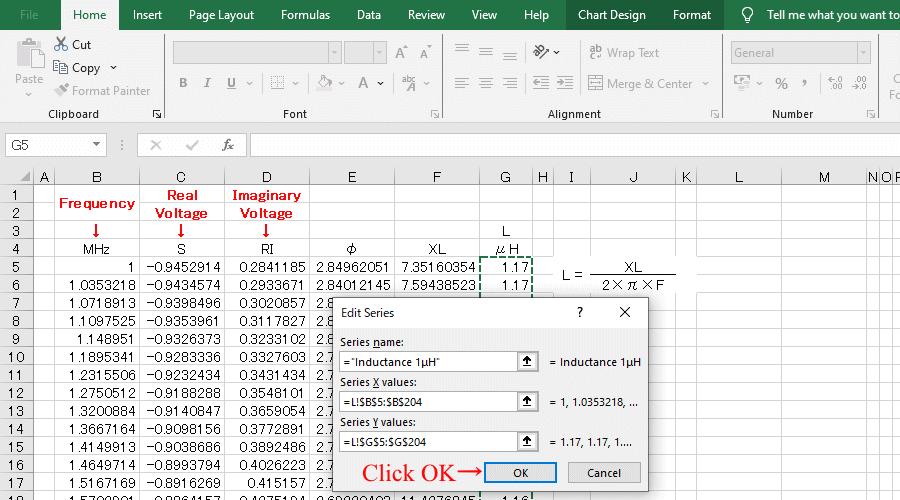 |
 |
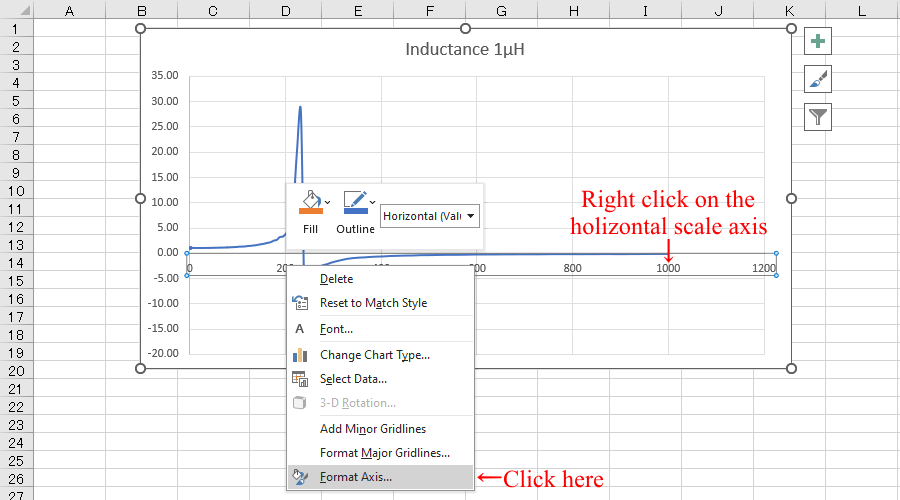
| Make graphs bigger and easier to edit, and edit by right-clicking the horizontal scale axis |
 |
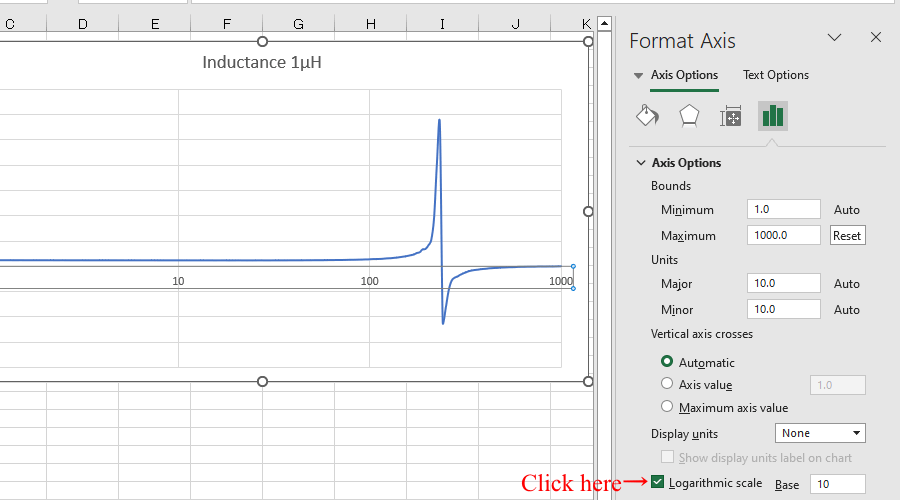
| Convert to logarithmic scale |
 |
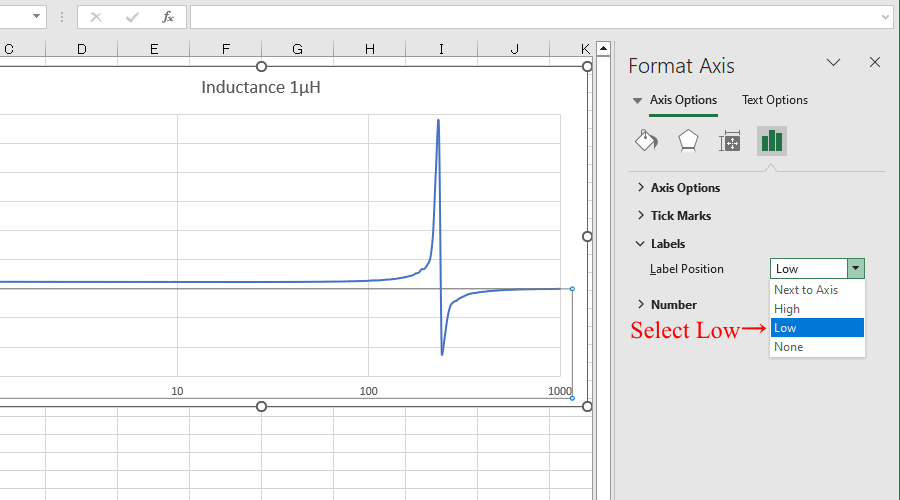
| Move the holizontal scale position |
 |
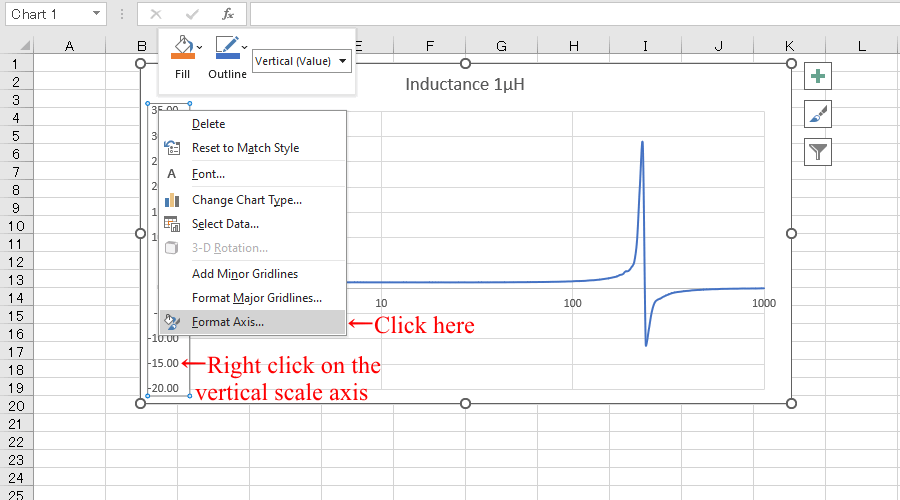
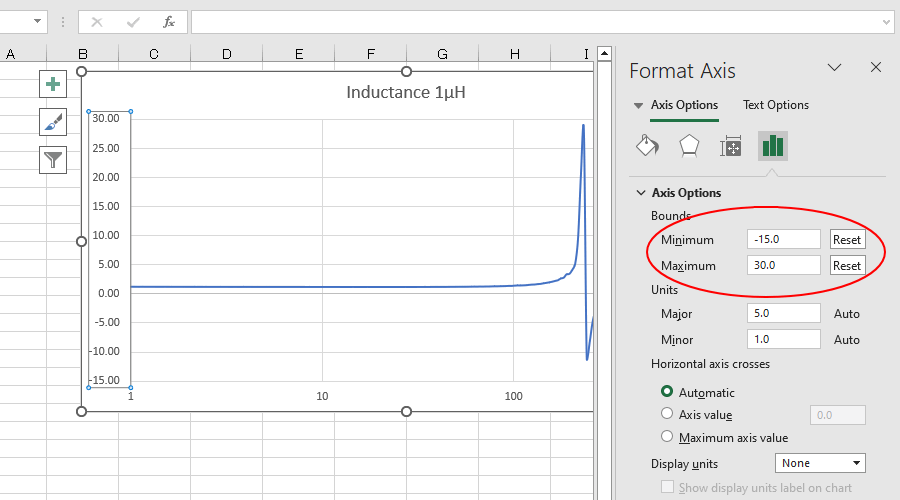
| Edit by right-clicking the vertical scale axis Change the maximum and minimum values of the scale. |
 |
 |
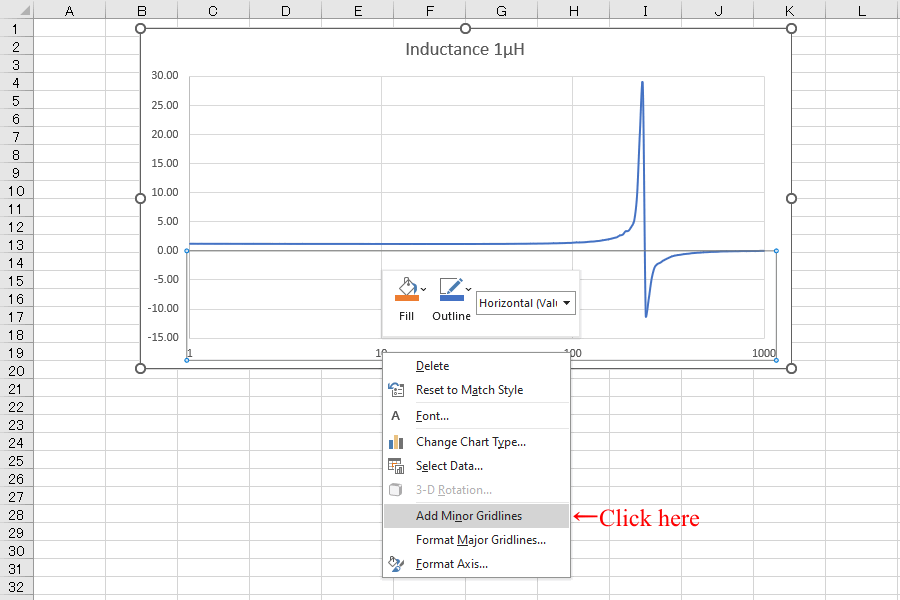
| Adds minor tick marks to the horizontal axis. |
 |
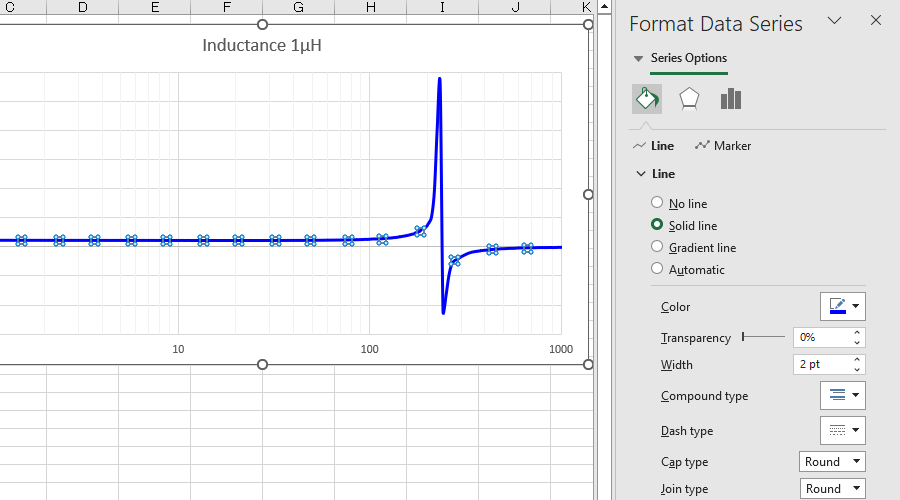
| Right-click on μH data line to edit |
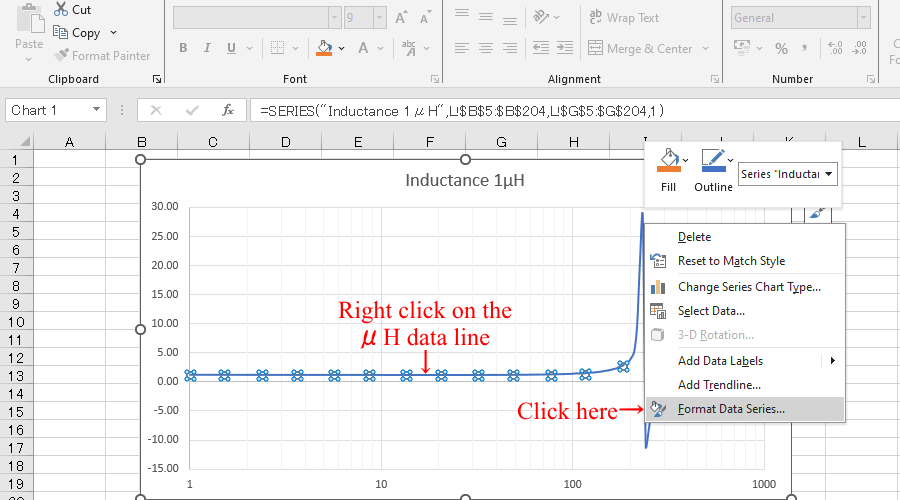 |
| Edit the color and thickness of the graph |
 |
 |
| Click here to download Create-S11LFgraph-VNWAs1p.xlsx |