Top > Technical-notes > VNWA > Import Line-Filter's VNWA data into EXCEL.

Import Inductor's VNWA S11data into EXCEL.

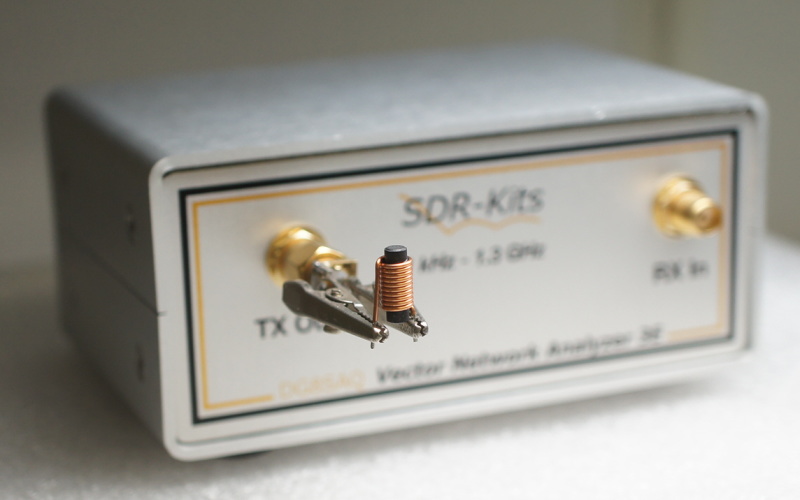
Measure and extract the S11 frequency characteristic data of the inductor as shown in the photo below.
Import the extracted data into EXCEL.
VNWA:Vector network analyzer (VNWA3E) DG8SAQ

This is a photo of measuring the S11 characteristics of a 1μH coil using a Vector network analyzer (VNWA3E) DG8SAQ.
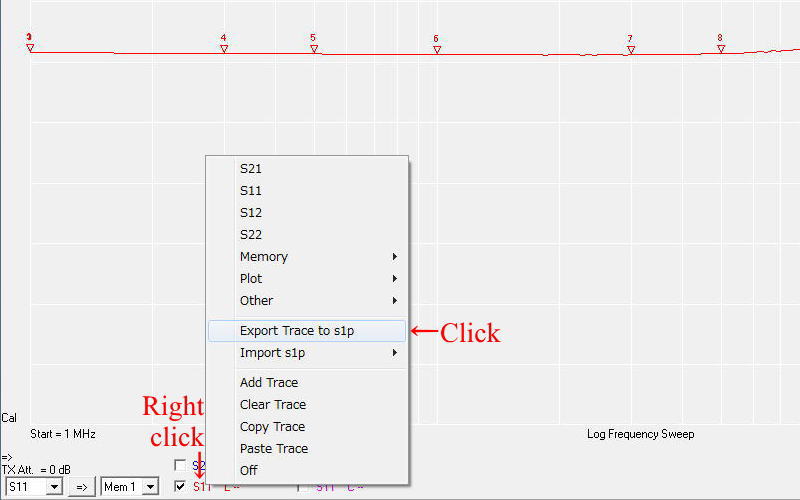
Right-click on "S11 L--" and a window will appear.
Click on "Export Trace to s1p".
This is an image explaining the steps for measuring the S11 characteristics of a 1 μH coil using the Vector network analyzer (VNWA3E) DG8SAQ and exporting the S1P data.
This is an image explaining how to add comments when exporting S1P data using the Vector network analyzer (VNWA3E) DG8SAQ.
This is an image showing the location where the data is saved when exporting the S1P data using the Vector network analyzer (VNWA3E) DG8SAQ.
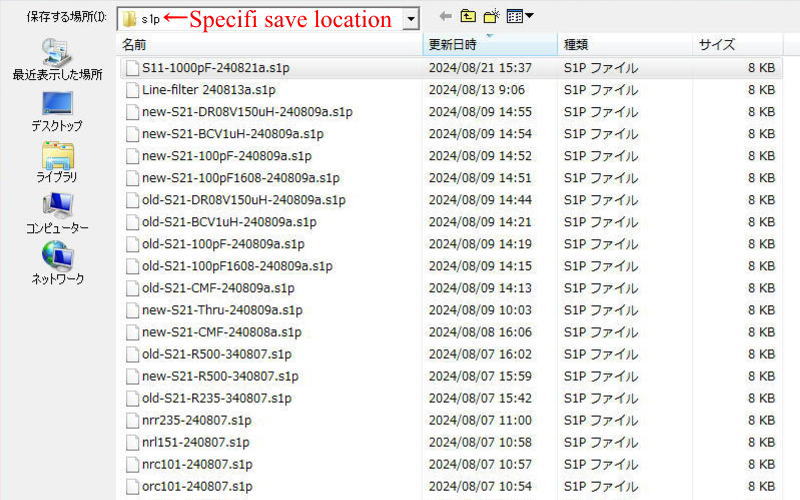
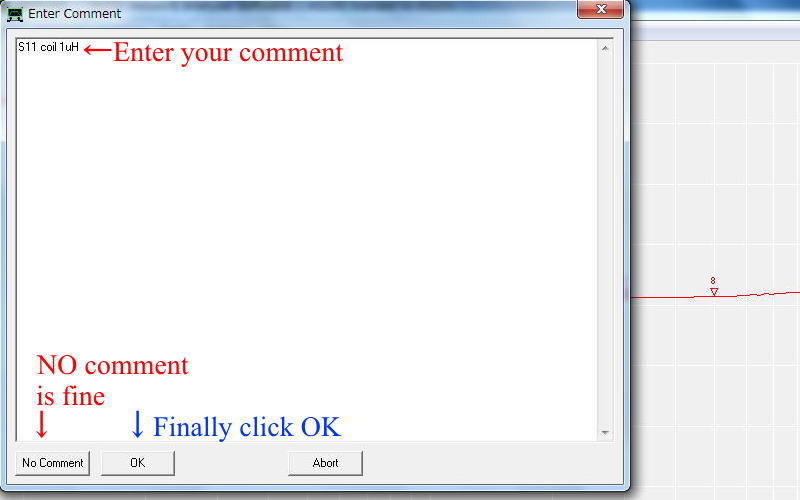
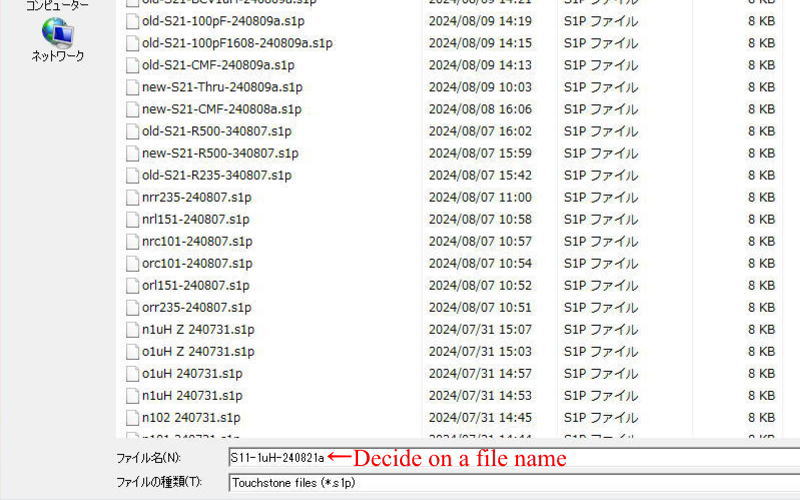
 Decide on a file name and save it.
This is an image showing the steps to measure the S11 characteristics of a 1 μH coil using the Vector network analyzer (VNWA3E) DG8SAQ and export the S1P data.
First, start EXCEL and open the file you just saved by selecting File → Open.
At that time, select all files.
This is an image explaining the steps to save the S1P data to a file using the Vector network analyzer (VNWA3E). Image showing how to open the S1P file saved after measuring the S11 characteristics of a 1 μH coil using the DG8SAQ
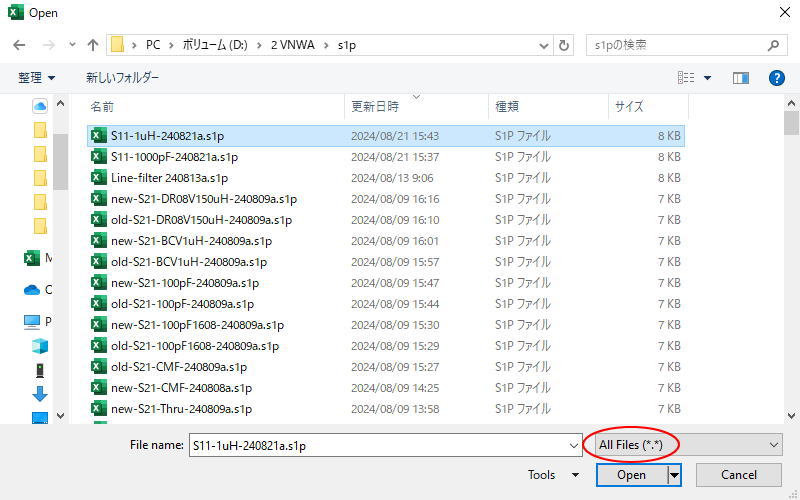
 When you open the file, a window like the one below will open, so follow the instructions in the image.  
This image shows how to import the saved S1P file into Excel using the Vector network analyzer (VNWA3E) DG8SAQ, specifying "Delimited" as the file format.
This image shows how to import the saved S1P file into Excel using the Vector network analyzer (VNWA3E) DG8SAQ, specifying "Tab" and "Space" as the data delimiter.
This image shows how to measure the S11 characteristics of a 1 μH coil using the Vector network analyzer (VNWA3E) DG8SAQ, specify "General" as the column and data format when importing the saved S1P file into Excel.
This is a data image taken immediately after measuring the S11 characteristics of a 1μH coil using a Vector network analyzer (VNWA3E) DG8SAQ and importing the saved (s1p) data into Excel.
  The data above 100MHz is shifted one square to the left, so we will correct it. 
This is a data image taken immediately after measuring the S11 characteristics of a 1 μH coil using the Vector network analyzer (VNWA3E) DG8SAQ and importing the s1p data. The image shows how to shift one cell to the right for data above 100 MHz.
This image shows the S11 characteristics of a 1 μH coil measured using the Vector network analyzer (VNWA3E) DG8SAQ, and the data is ready to be used to create a frequency response graph.
 Convert Inductor's VNWA-s1p data to inductance.
Displays the converted Inductance data as a graph.
Click here to download Create-S11LFgraph-VNWAs1p.xlsx

© SMPS Solution